Narrowband imaging is a powerful tool to reveal the physical/chemical composition of nebulae. Most emission nebulae have a deep red tone if viewed using the regular broadband because excited hydrogen dominates their composition. With narrowband imaging, those nebulae would become much more colorful, which is important for both science and artistic effects. This post assumes the reader is familiar with narrowband imaging, and introduces a method to create novel palettes other than the popular SHO (the Hubble Palette), HOO, or HSO. From an art point of view, the problem of those palettes is, the saturation of the colors are much too high (pure red, green, or blue). Although it's possible to do some hue and saturation adjustment after color synthesis, the degree of freedom is quite limited. Therefore, One straightforward question to ask is, if I have a set of colors in mind, is there a way to realize that into an image? If this is possible, astrophotographers could take advantage of the numerous palettes online to create aesthetic photos.
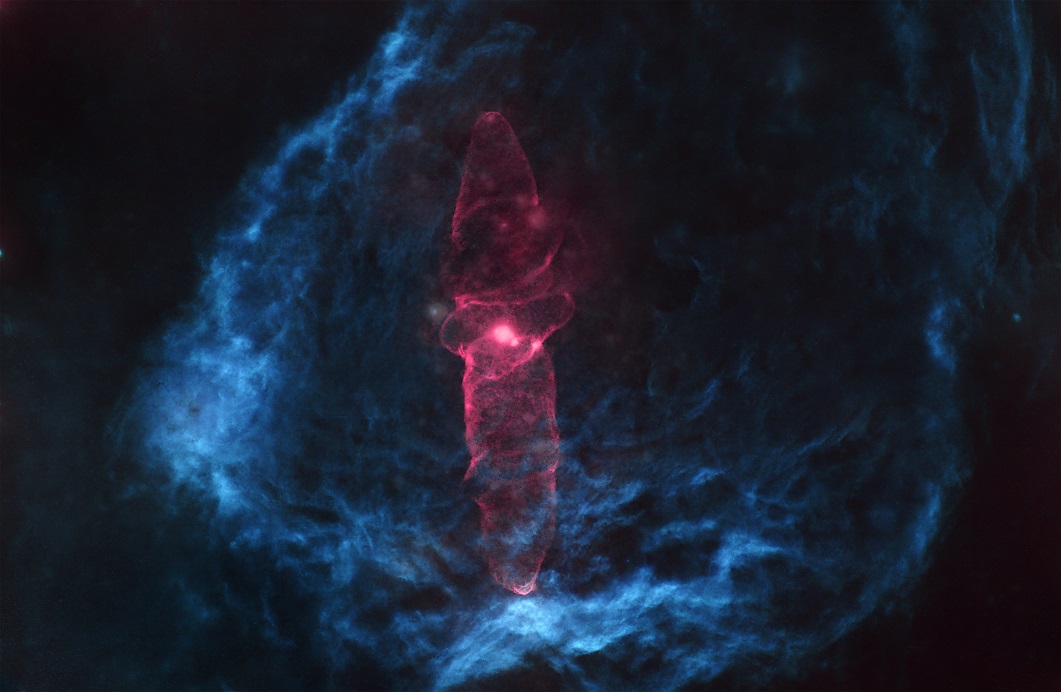
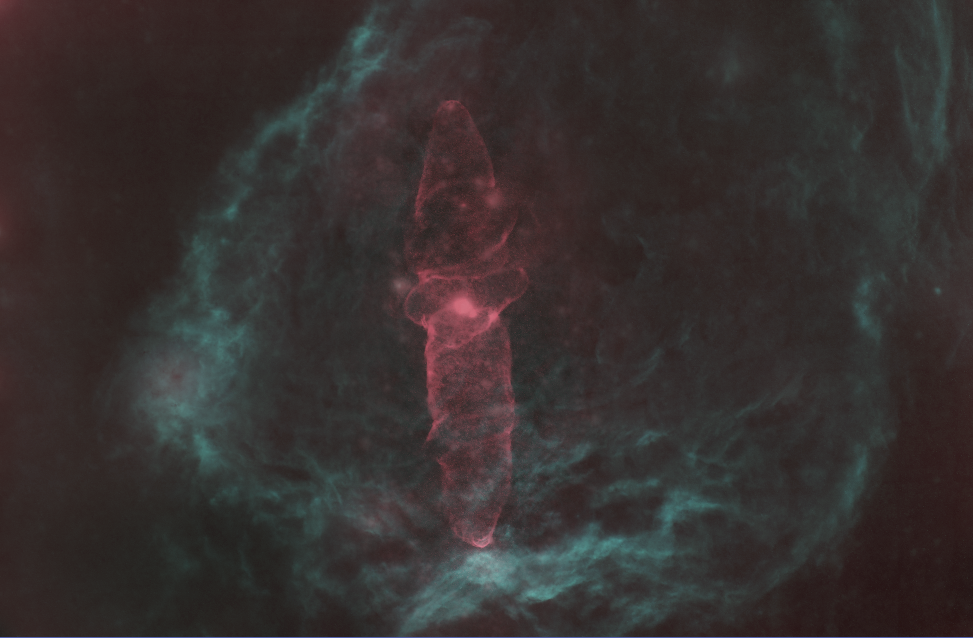
Below is an example of the proposed technique. For the Squid Nebula, we got our inspiration from the movie "The Matrix," and use an alerting pinky red to colorize the Oxygen emissions. For the background Flying Bat Nebula, we use ocean blue to present the Hydrogen and Sulphur emissions. So we get an analogy of a mechanical squid swimming in the sea of Zion, alerting for any possible threats. Note the saturation of the colors isn't too high, making it more visually pleasing.
How did we achieve this? In the following text, we will first introduce the specific steps to get the effect, and then the mathematical principles behind. The overall process is simple, and can be divided into two parts. First we pick up the colors in software like Photoshop. For example, for Hydrogen Alpha, if we wanted to use ocean blue, we just pick it in the color picker:
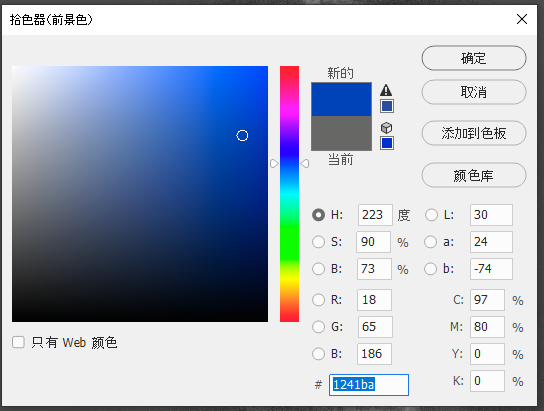
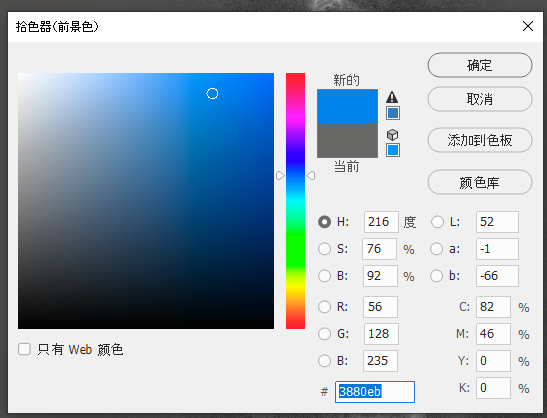
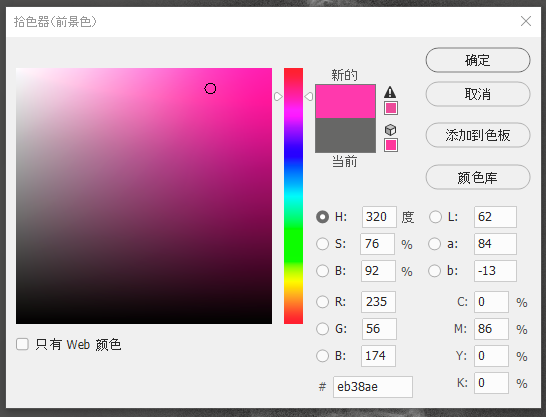
Take notes on the RGB values, 18, 65, and 186. Similarly, we use a pinky blue (56, 128, 235) for the Sulphur II, and some kind of magenta (235, 56, 174) for the Oxygen III.
Then we got this table of the RGB values of H, S, and O (each row):
    R   G   B
H   18  65  186
S   56  128 235
O   235 56  174
And here comes the second step. If we view this table vertically, and multiply the number in each column with each channel, we can get a PixelMath formula (in PixInsight). For example, if we take a look at the column of R, the corresponding numbers for H, S, O are 18, 56, 235 respectively, and then we can get the formula for the R channel as
.
But here is still a problem, i.e. the result would fall outside the original range of pixel values.
So we still need to normalize it by dividing the result by the sum of the three numbers.
So the final formula of the R channel is (18*H+56*S+235*O)/(18+56+235).
If we do the same to the G and B channels, the final formulas are:
- R:
(18*H+56*S+235*O)/(18+56+235) - G:
(65*H+128*S+56*O)/(65+128+56) - B:
(186*H+235*S+174*O)/(186+235+174)
If we put it into the PixelMath, the outcome looks like:
We can see that the red is very similar with what we picked. But the background is quite different. This is because the background (Flying Bat Nebula) has both H and S, which mixed into cyan like this. We could use CurveTransform tool to adjust it, which doesn't fall beyond the capability of simple tweaking.
If we generalize it a bit, actually we could so the same thing on the RGB images, just pretending it's narrowband channels. It could even be used on four or more color channels, just by extending the table above to four rows. In general, this method uses simple math (nothing more than summation, multiplication, or division) to provide a systematic, extensible, and controllable way to realize a palette.
If you still have interest and energy, we could talk about more math now and explain the principles behind. The color synthesis problem is actually a typical problem of linear space projection in linear algebra. Now we have three orthogonal basis, H, S, and O, which spans a linear space. This means any vector (H, S, O) in the space has its unique coordinate, which is exactly the pixel values in the H, S, O channels. And now our problem is, if we want to project this linear space to another set of basis, how do we calculate the new coordinates (R, G, B) of the vector (H, S, O) in the new space? In general, the new set of basis should be orthogonal as well, as in SHO palette. But in our approach here, we relaxed this constraint, and allowed the base colors to be correlated, while we still use the same technique (of orthogonal basis) to do the projection. And the projection is actually nothing more than a linear transform, or a matrix multiplication with the old coordinate (H, S, O) in linear algebra. The transform matrix is also trivial. It's just the collection (stacking) of the three new basis. So we have the transform as:
Here R is the transform matrix. If we take a look at the internal of the matrix, that is:
This is exactly the table we used above, with a simple transpose. So in this matrix, it's the first column instead of first row that indicates the RGB values of the H channel. By this way, we are able to quantitatively control the color synthesis process of narrowband imaging. And especially because we don't require the matrix \(R\) to be orthogonal, it could be used in a projection of more than three channels.