When city lights grow dim and the night sky becomes crystal clear, you might notice several particularly bright planets, as though they’ve agreed to line themselves up in the heavens. That’s what we call a planetary alignment. Even though these celestial bodies don’t actually form a perfect geometric line in space, they can appear to align from our viewpoint on Earth, creating a visually striking row. Since the start of 2025, various media outlets around the world have been abuzz with talk of so-called six-planet or seven-planet alignments. Some are awed by it, while others question the science behind it. If we’d like to identify all possible n-planet alignments over the past 20 years (or any chosen time span), how might we go about it?
A common approach in modern astronomy is to use computer programs to simulate planetary positions and make quantitative assessments. Planets don’t wander randomly; they move along their own elliptical orbits around the Sun. Their relative positions in the night sky can shift over days or even hours, but by knowing each orbit’s parameters and taking Earth-based viewing conditions into account, we can accurately calculate their coordinates at any point in time. Happily, there’s no need to do this manually. Tools like the Skyfield library provide high-precision planetary ephemerides and allow us to convert solar system coordinates into positions for an observer on Earth.
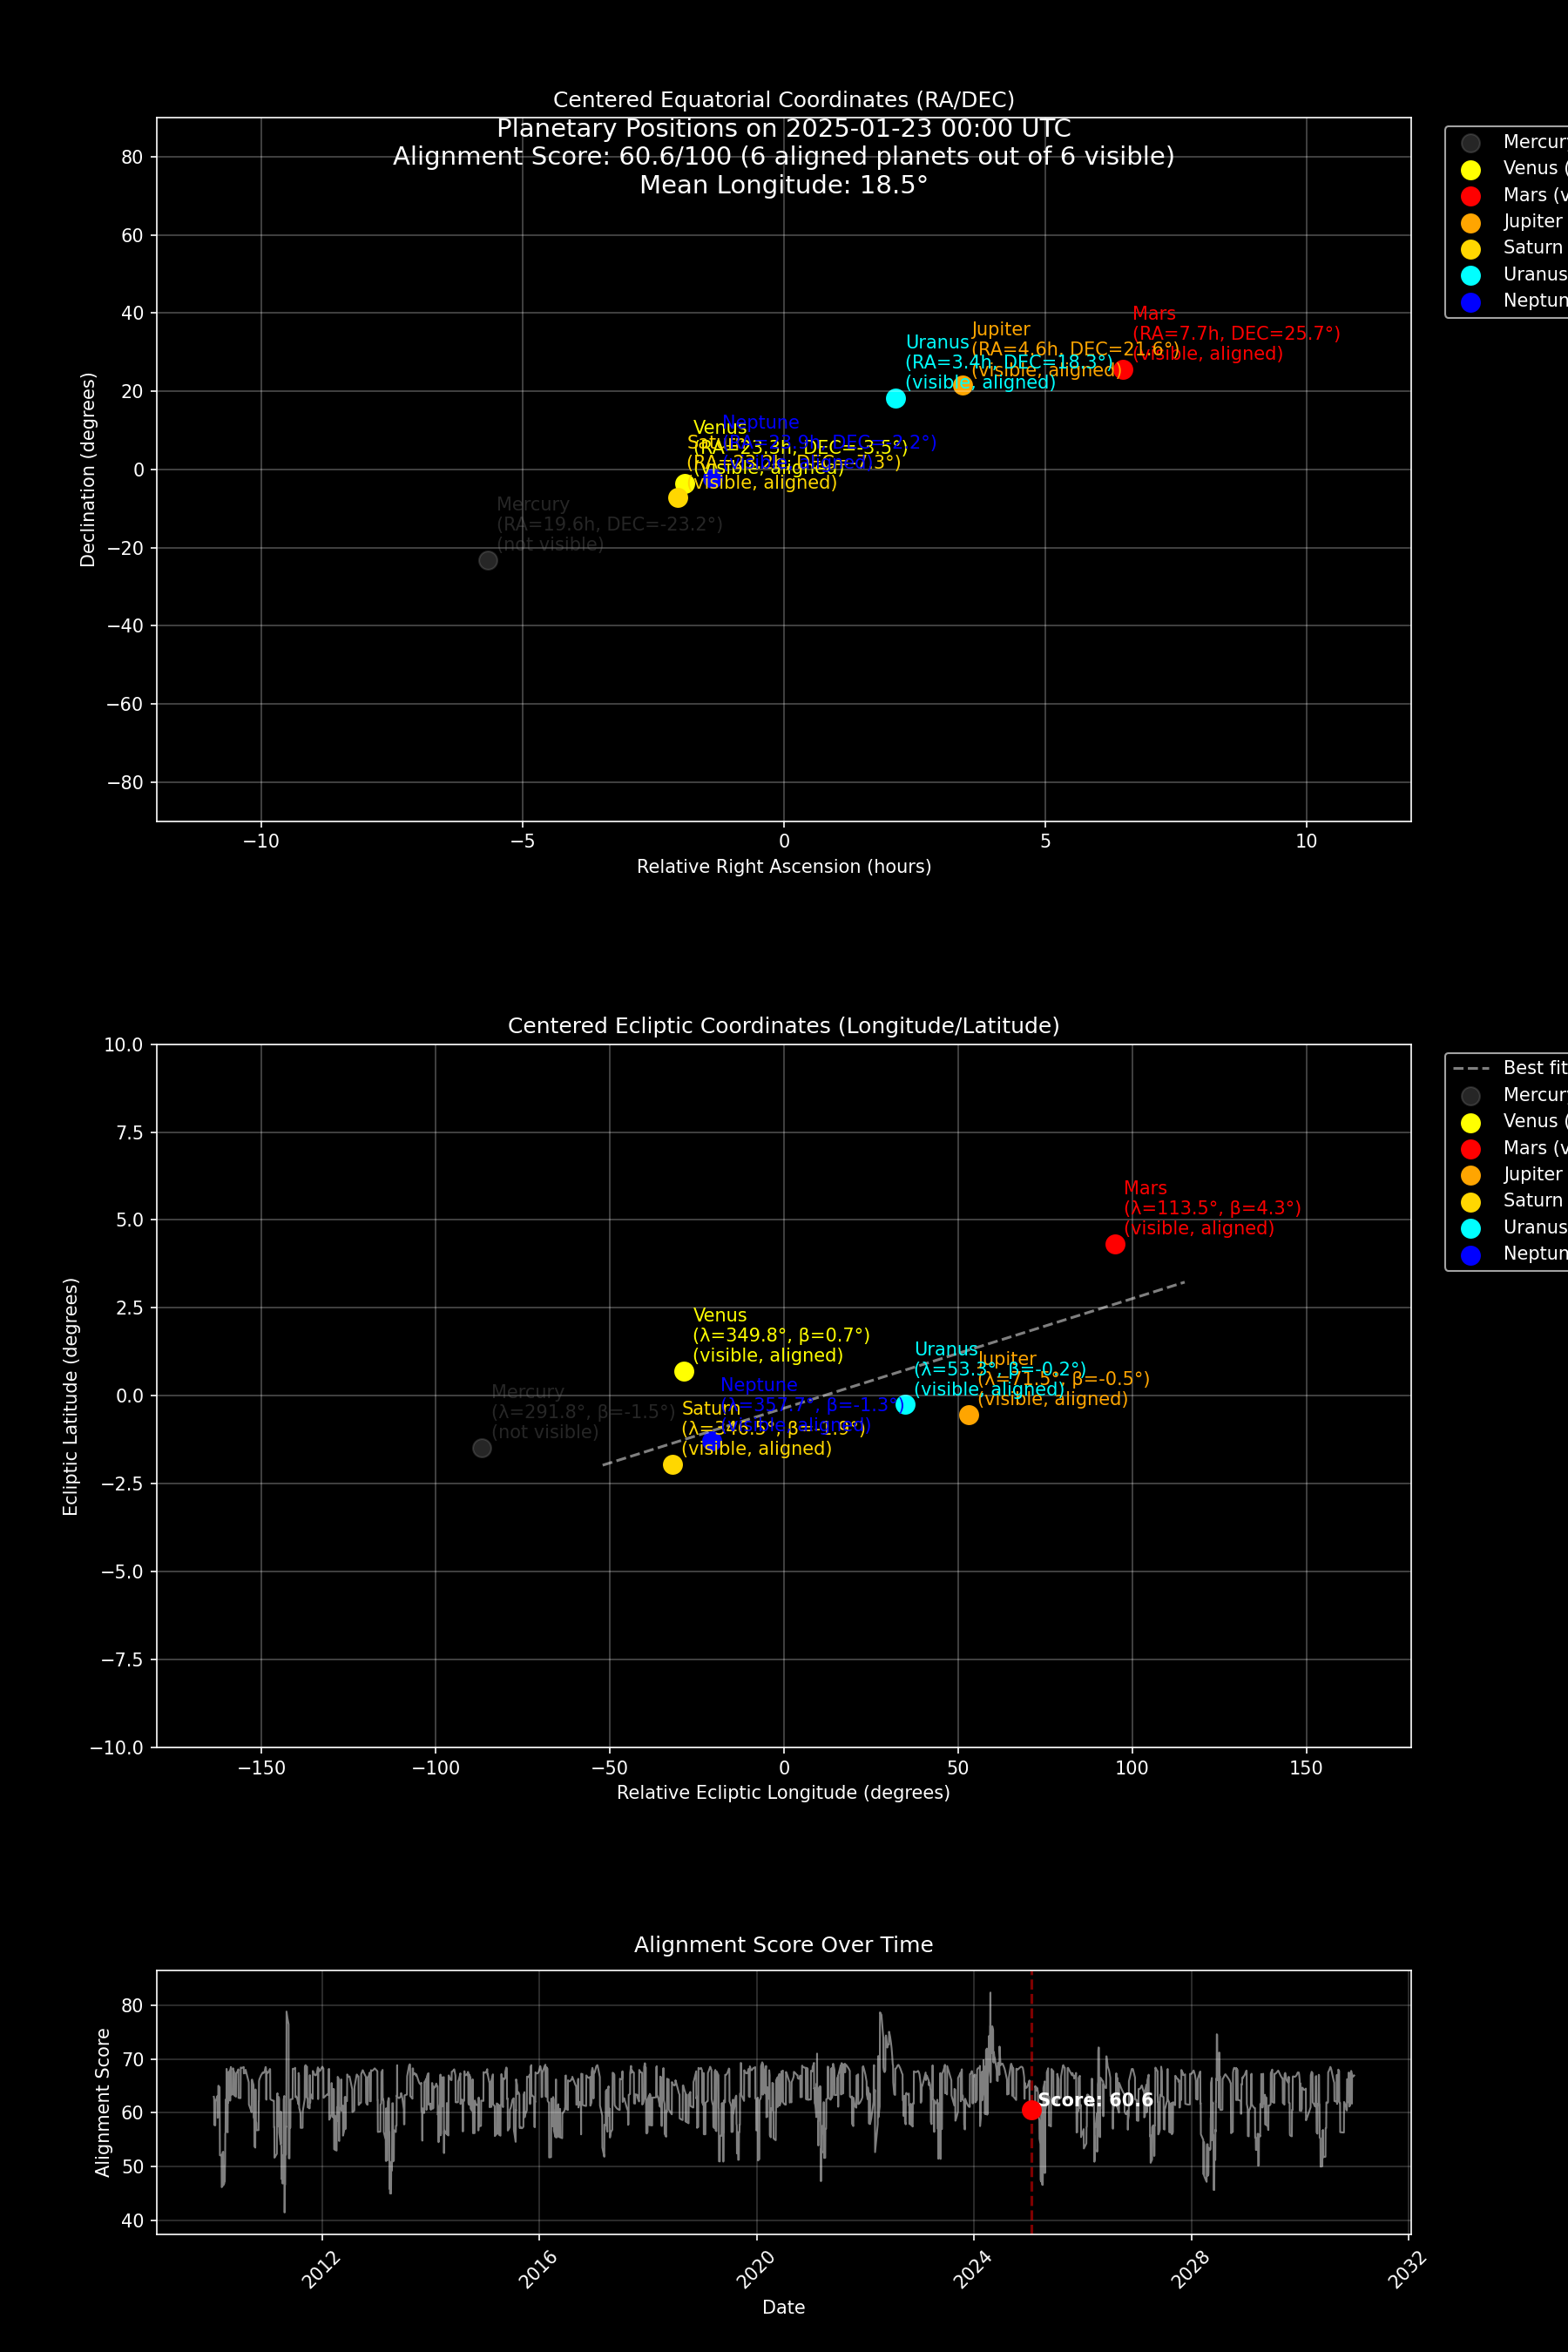
However, planetary alignments mainly depend on the geometric positions of the planets orbiting the Sun, while Earth’s rotation has comparatively little effect. For ease of analysis, we usually record planetary positions in the ecliptic coordinate system, using the ecliptic plane as a reference. From our vantage point on Earth, the Sun appears to move slowly across the sky over the course of a year, tracing a path known as the ecliptic. This line matters because Earth’s orbit defines the ecliptic plane, and most planets’ orbital planes don’t deviate much from it. When we convert planetary coordinates into the ecliptic coordinate system, we get a clearer picture of how they’re arranged around the Sun.
Mathematically, ecliptic coordinates don’t change the actual angles between planets, but they make it easier to see whether these planets are clustered within a certain range of ecliptic longitudes. In a practical program, we might choose a specific time span (say, 2010 to 2030), and at each time step (daily or more frequently), compute the planets’ ecliptic longitude and latitude.
But just knowing where the planets are doesn’t by itself tell us whether they’re aligned. The real challenge is to give a quantitative definition to what might look like “an orderly arrangement.” We can break that intuitive sense of alignment into measurable parts:
First, these planets need to be visible at night—otherwise they’re just following the Sun’s daily rise and set. This might sound trivial, but given that most planets stay close to the ecliptic, it’s actually the biggest factor. If most of these planets are lost in the Sun’s glare or below the horizon, there’s no chance for a visually striking alignment. So we begin by figuring out which planets can be observed from Beijing (or any location), based on the positions of the Sun, the planets, and the local horizon. We only count the visible ones in that moment, and use that number of visible planets to form part of our alignment score. The more visible planets there are, the higher the “alignment index” at that time.
Second, we care about whether they line up more or less along a single line in the sky. The simplest way to measure this is to do a least-squares fit for the coordinates and see how well they can be approximated by a single line. Specifically, we take each planet’s ecliptic coordinates (longitude and latitude) at that moment and feed them into the algorithm, fitting for the best line. Then we examine the average or maximum distance of each planet from that line—the smaller the distance, the more aligned they are. There’s a small caveat, though, because Mercury and Venus (the inner planets) move much faster and sometimes deviate more from the ecliptic. That can drag down the score even if the other planets are nearly perfectly aligned. In such cases, you might still be seeing a flawless five-planet alignment, so for robustness, we use a more advanced algorithm called RANSAC, which can handle outliers like Mercury and Venus without ruining the entire alignment score.
Lastly, we often care about whether these planets are clustered in a particular region of the sky. Compared to a line that spans a wide swath of the sky, a line that’s fairly short—like a group of planets bunched in one small area—can be visually more impressive. Because most planetary orbits have only a small inclination to the ecliptic, their ecliptic longitudes are what primarily determine whether they seem to cluster together in the sky. We can calculate the distribution of longitudes (for example, their range or standard deviation) and note that a smaller spread means they’re packed more tightly, thus more likely to appear as if they’re in a common arc.
Once we have these three indicators, we can make a quantitative assessment of whether the planets are in alignment at any given time. The steps are:
- Pick a time range (for example, 2010 to 2030) and compute planetary positions at set intervals (daily or finer).
- For each sampling point, calculate how many planets are visible, their linear alignment (fitting quality), and their longitude clustering.
- Combine these three metrics with weights of 40%, 30%, and 30%.
- Plot that combined score over time to see when alignments become prominent and then dissipate. Whenever you see a prominent peak, there’s a good chance that a notable n-planet alignment is occurring.
This method translates the subjective notions of “they seem lined up” or “they appear clustered” into something more reproducible. When the score peaks, you can be more confident that there’s an eye-catching alignment going on in the night sky. In other words, this quantitative approach helps us identify periods in the past 20 years (and predict in the future) when an n-planet alignment is likely to appear. If we really did write a program for it (open-sourced at https://github.com/grapeot/PlanetAlignment) and ran it on the 2010–2030 data, we’d see that January and February of 2025 aren’t that outstanding. In fact, July 2025 would produce a more impressive alignment by these standards.
But keep in mind that while we’re using rigorous math, the entire process still carries a lot of subjectivity. For instance, many other media outlets discussing nine-planet alignments don’t insist on them being grouped into a small patch of sky. Moreover, our chosen 40/30/30 weighting heavily influences the final score. If you were to boost the weight on linear alignment, the scores for January and February this year would jump up significantly. But if you emphasized the longitude clustering metric instead, their scores would drop. It’s akin to college rankings: ramping up or down the importance of certain factors can send a university soaring or plummeting in the rankings. Sounds familiar, doesn’t it?
The point is, we should view the math described here with nuance. On one hand, it’s a huge leap forward from a fuzzy idea to a measurable index, letting us quickly search through decades or even centuries of data. On the other hand, it’s still inherently subjective. Simply tweaking a few weights can drastically shift the results, so we shouldn’t regard these mathematical methods as absolutely definitive.