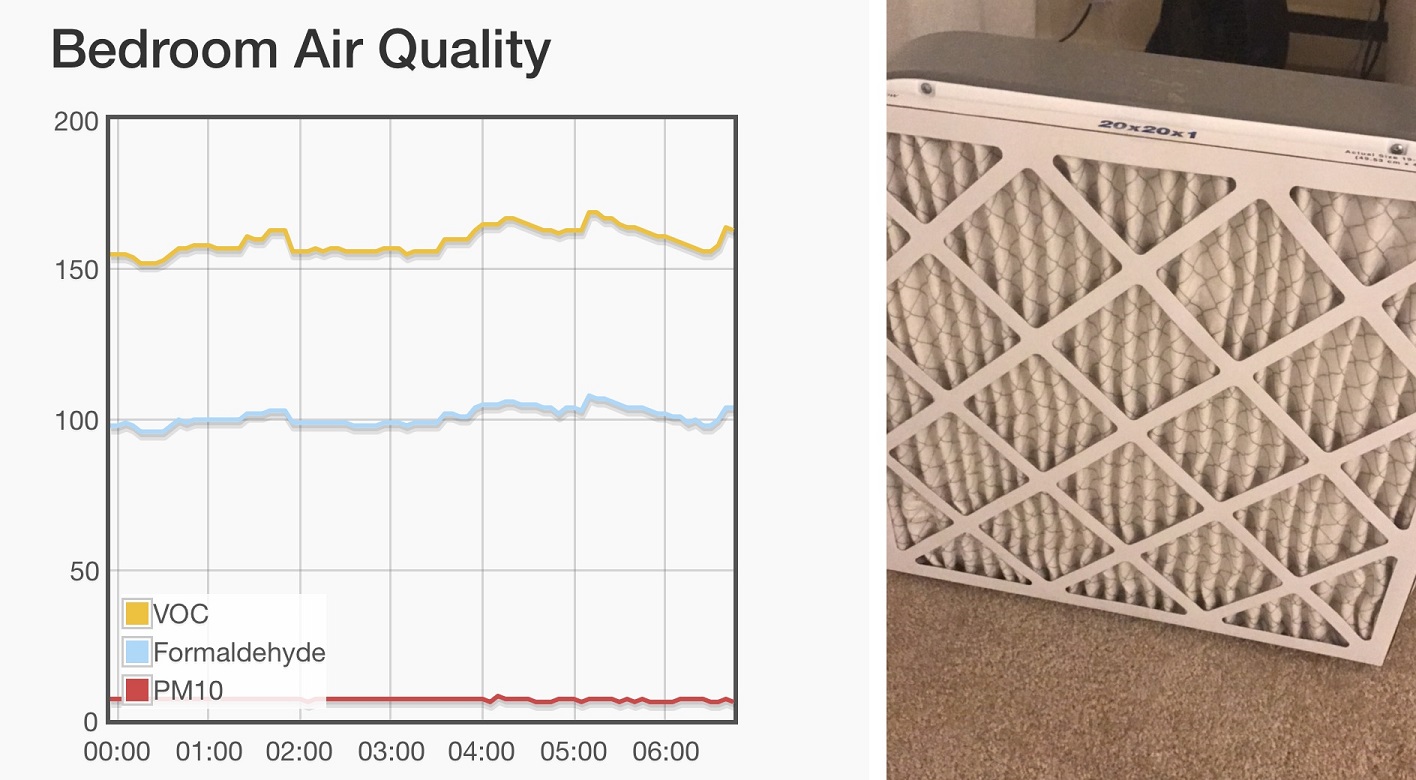
Indoor air can be much more polluted than the outdoor air. There are some "smart air purifier" like Dyson Air Purifier on the market, but they are usually very pricey, and lack APIs for customization. That's why I used a Raspberry Pi to build a smart air monitoring system, which also has a DIY purifier. The monitoring interface looks like the screenshot below (left), and the purifier (right) will automatically launch when the pollutant level reaches a threshold. In this post, we will introduce how to build such a system, with explanation of why we design it so. Note this post is not for completely beginners. You need to have basic Raspberry Pi experiences (install OS, set up network/wifi, write simple python codes, basic knowledge of how GPIO works).
TL;DR: this post is a combination of the following post:
- How to use an MCP3008 ADC to read from analog sensors on Raspberry Pi (link)
- How to use the SPI on Raspberry Pi to read from MCP3008 (which further simplifies the code) (link)
- How to use a Sharp GP2Y1010AU sensor to monitor air quality on Arduino (link)
- How to build a DIY air purifier using a box fan and a MERV 13 filter (link)
I haven't found a tutorial online about how to use a GP2Y1010AU with Raspberry Pi, so I thought it would be helpful to write one here.
Framework and Test-Driven Development
The system is expected to do four things:
- Fetch readings from the sensors;
- Host a website, such that the data fetch operations can be triggered by visiting a web page (i.e. providing an API);
- Have a simple UX, allowing the users to observe the changing trend of the readings (in a browser session);
- [optional] Have a database to store the reading history, so that longer visualization is possible.
Based on the feature requirements, we design the system architecture like this:
User <==> Tornado/Python website <==> Raspbarry Pi GPIO Ports <==> Sensors
And to get a more comprehensive understanding of the air quality, we will use two kinds of sensors, one measuring the gas pollutants such as NOx, alcohol, NH3, CO2, and Benzene, and the other measuring the dust pollutants (PM2.5 and PM10). We use MQ135 for the former and Sharp GP2Y1010AU for the latter.
In the following part, we will first introduce how to use an MCP3008 chip to read from analog sensors (use MQ135 as an example), and then introduce how to use Sharp GP2Y1010AU Dust Sensor, followed by how to build a website to allow users to access the data easily (which is an essential advantage over Arduino!). But before we dive into details, a critical question still remains: how can we know it's working? Is the sensor working properly? Is the ADC working as expected? Is the overall wiring correct? Is the system working from end to end? I'm from a software background, and the questions can be answered with tests. It's usually a good practice to have the tests before building the system. For our system, an End-to-End test is, if we spray some pollutant next to the sensors, the readings should raise dramatically in a short time, and gradually get down. For the gas sensor, the pollutant could be some breath after drinking alcohol. And for the PM10 dust sensor, the pollutant could be tearing a paper towel near the sensor. If we observe the readings raise after doing this, we can basically confirm the system is working.
Similarly, we also need tests to make sure each single component is working properly before connecting them together. This is called unit tests. For the gas sensor, we can do similar pollutant test without the ADC. But as will introduced below, Raspberry Pis cannot read from analog sensor without an ADC. Therefore, we directly use a multimeter to measure the voltage between its legs to get a real "unit test" without introducing more elements such as ADCs or Raspberry Pi controllers. It's the same for the dust sensor.
MCP3008 ADC + MQ135 Sensor
MQ135 is a sensor able to detect common pollutants in the air, such as NOx, CO2, NH3, and Benzene. It has a thin layer of SnO2 on the surface of the sensor. When there are target gas molecules present next to the layer, the gas molecules will have (reversible) reactions, and change the resistance of the layer, which can then be measured. The datasheet of MQ135 can be found here. It has everything you need and you're encouraged to read it in detail.
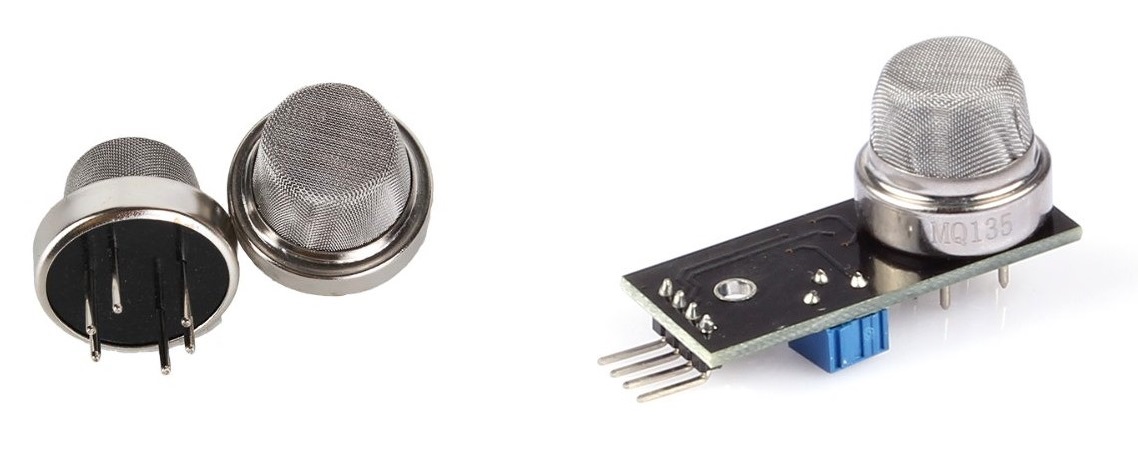
As we can notice in the photo (left), MQ135 is not breadboard-friendly, with six legs in a circle. Fortunately, in addition to the sensor-only edition, what you can buy in the market also include a "breadboard-friendly" edition, which has a nice PCB doing the dirty wiring work, and usually has a better-defined interface. For example, for MQ135, instead of six legs, the PCB version has only four legs, VCC, GND, AOut and DOut. VCC and GND need to connect to 5V and Ground respectively. DOut is a digital output pin which can directly read by Raspberry Pi. It will usually be high, unless the sensor detects above-threshold concentration of the gas (I'm not sure whether it's usually high or low though. Better look up the docs to confirm) Because it doesn't output the actual concentration, we don't use it here. AOut will output a voltage indicating the gas concentration. There is a chart showing correspondences between ppms of different kinds of gas and the output voltage in the data sheet.
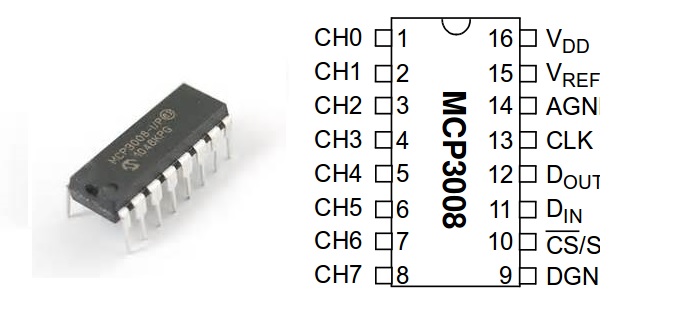
A tricky part here is, unlike Arduinos, a Raspberry Pi cannot directly read analog inputs. That is, it cannot directly measure the voltage between two pins, but can only tell whether a pin is in high level (a binary 1) or in low level (a binary 0). Therefore we need a Analog Digital Converter (ADC) to do the job of measuring the voltage, and translate it to digital language using some protocol. And the "some protocol" here is Serial Peripheral Interface (SPI), which is natively supported by Raspberry Pis. So what will happen next is you wire the circuit according to the protocol (basically VCC, GND, and hook up MISO to MOSI, and vice versa, pretty like TX to RX, RX to TX), and copy-paste some example code snippet to make it work. There are quite a few great examples/tutorials online, so I don't repeat their work here. I directly used the wiring and code from this post. A trap is, if the output voltage is in the range of 0~5V, you should make sure both the VRef and VDD in MCP3008 are in 5V. Previously I thought these two are independent, and got quite off values (the relative trend was correct though).
You can also find a photo of MCP3008 below for your amusement.
Sharp GP2Y1010AU Dust Sensor
In addition to the chemical gas, dust sensors can capture another aspect of air quality. Very fine dust (diameter <2.5 micrometer) can directly arrive in our lungs and the blood vessels inside. There are two types of sensors that can measure the amount of dust in the air. One cheaper type uses infrared as the light source. There is a phototransistor placed outside the path of the infrared light. When there is no dust in the air, the phototransistor will receive no light and have very large resistance. But when dust is present in the air, the infrared will be deflected in all directions, and by measuring the resistance of the phototransistor, we are able to know how much light it receives, and then calculate how much dust in the air. This method is usually able to detect the total amount of the dust, but not knowing the distribution of the diameters of the dust.
Another type of the sensor is based on laser. The laser goes out of the light source, first passes a polarizer, gets deflected by the dust particles, and then passes another polarizer to form scattering patterns. Then for a single point in the pattern, we can calculate the autocorrelation coefficient along with time. This autocorrelation is expected to decay along with time given the particles in the air are in Brownian motion. But how fast it decays can reflect the (average) size of the particle, given larger particles usually have a slower velocity. Then by fitting a exponential decaying model, we are able to quantitatively estimate the size of the particles that deflect lights to this specific point in the pattern. By summing up these diameters, we then can get the distribution of the dust size. This kind of sensor is usually more accurate, but also requires more powerful hardware, and thus is more expensive.
About the performance of different kinds and brands of sensors, there is an overview and quantitative test on aqicn.org. Here we use a cheap infrared sensor from Sharp, with the model GP2Y1010AU as an example. We didn't use the raw sensor, as in many other tutorials, but used a sensor mounted on a PCB, so we don't need to find a resistor and a capacitor to protect the infrared LED. The chip has a similar leg setting as the MQ135 sensor, with a VCC, a GND, and an AOUT. The only difference is it also has an infrared driving pin ILED for input. This pin controls when the infrared is on (high) and when it's off (low). According to the data sheet, in order for the sensor to work accurately, the pin should be driven in a PWM manner (As below).
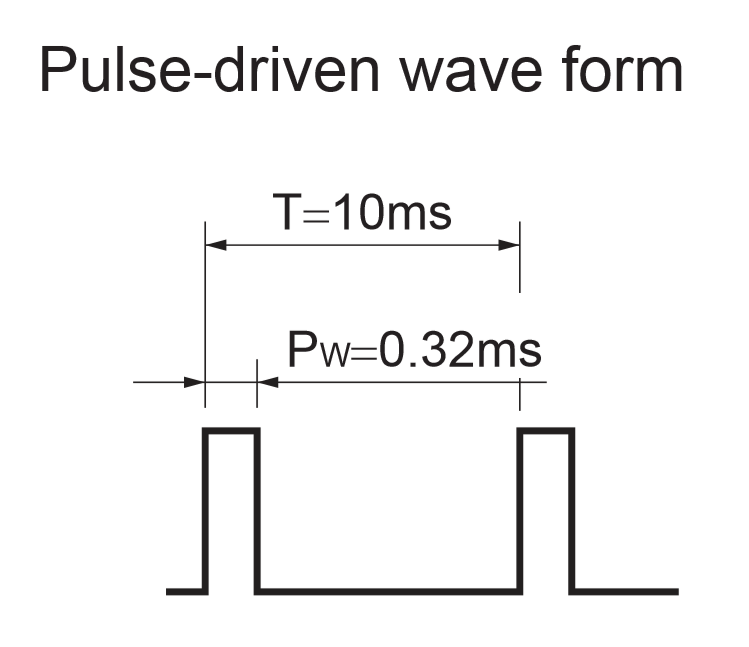
It's a trivial task on Arduino because it runs a real time OS, but for Raspberry Pi running multi-tasking OSes like Linux, it's not an easy task. Fortunately we have a cool library named WiringPi, which allows us to sleep in hundreds of microsecond level, although it's not guaranteed to be accurate due to the nature of the OS. We will use this to drive the ILED pin.
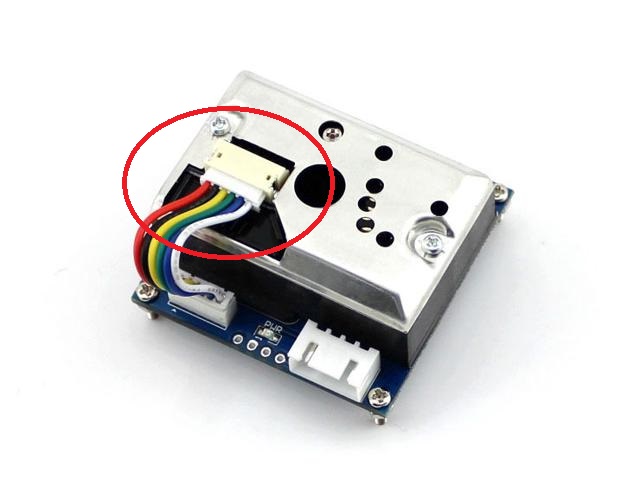
Another trap that costed me several hours is, you need to make sure the wires between the PCB and the sensor is connected and tight. I didn't connect it and spent quite some time to debug it out. I know it's stupid, but shit happens... The connection is circled in the figure below.
The wiring of the sensor looks like
- GND <-> GND
- ILED <-> GPIO port 18 (this is arbitrarily chosen, and you are able to find out the correspondence of port id and its location in charts like this. Note I used a Raspberry Pi 3 and the port 18 means it's GPIO Pin #18, not the 18th pin on board.)
- AOUT <-> Channel 2 on MCP3008
- VCC <-> 5V
And the core code can be found in this file. The overall working repo is available here.
Web Data Access and Visualization
For electronics DIYers, possibly it's a less familiar term of web development. Just like embedded development, it requires some time and practice, but beginning from reading and modifying examples, it's not hard get something to work. My code is all online, and the web server part is no longer than the GPIO part. For a simple example to use the library I use (Tornado), you can find it on the official site (link).
Before we leave you to read and mess with the code, let me brief introduce the basic idea of web development.
Web development is generally divided into two parts, both of which are necessary in our scenario.
There is a piece of code running on the server, responding the requests from the user/browser.
It is called the back end.
Another piece of code is running inside the browser, processing the data from the backend.
And it is called the front end.
In our app, when someone visits the homepage of the web page, the front end first runs within the user's browser, which then asks the back end for the readings of the sensors once per second.
Each time the back end receives a request from the front end, it does the heavy lifting, checking the GPIO levels, interpreting the SPI protocol, doing whatever we introduced above, and then returns the results.
And then finally the front end uses a library called flot to draw a beautiful plot to visualize how the readings change over time.
In our codebase, the front end is in /views/index.html, and the back end is in main.py and utilities.py.
Again, the code is available on github.
Air Purifier
The DIY air purifier is simple. Find a 20inch box fan, and a 20 or 21 inch furnace filter. Use a tape or whatever to stick them together. Bang, it's done. A small trick is, you can actually use some WiFi plugins to make it "smart" and controllable from Raspberry Pi. Wemo and IFTTT's Maker Channel can do this job pretty well. The only concern is, the WiFi plugin is sometimes even more expensive than the purifier itself.
In summary, the take-away message I wish you to remember is not (only) how to wire the sensors, how to write GPIO code to read the metrics, and how to write Tornado apps to host them on a website, but more importantly, the idea of test-driven development, the importance of reading data sheets, and the general idea of putting everything together to build a reliable and easy-to-use system. Hope this post is useful.
Comments